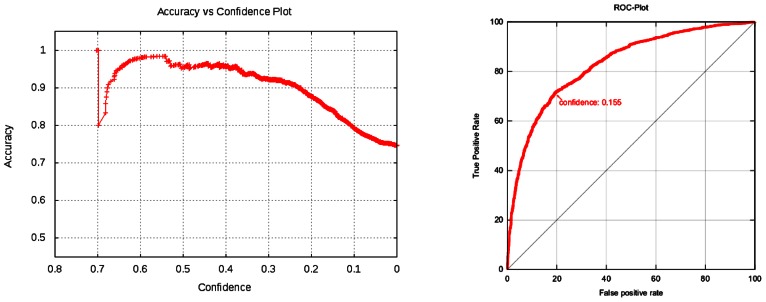
FIGURE 3.
Kazius/Bursi Salmonella mutagenicity dataset: total accuracy (left) and the class specific accuracies (right). The left plot shows that model accuracy decreases with decreasing confidence (variability at the left hand side of the plot can be ignored, because they are artifacts from small sample sizes). Note that prediction confidences are not probabilities or any statistical measure of model performance. These values can be obtained from plots in the validation reports, by identifying the confidence value on the x-axis and looking up the corresponding value (e.g., accuracy or R-Square) on the y-axis.

