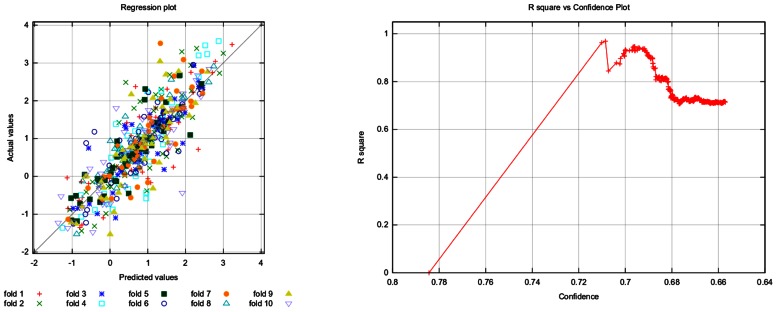
FIGURE 4.
Fathead minnow acute toxicity dataset: actual against predicted values (left) and R-squared against confidence (right). The left plot shows the correlation of model prediction and actual values. The plot on the right shows that the model performance decreases with decreasing confidence (see description of Figure 3).

