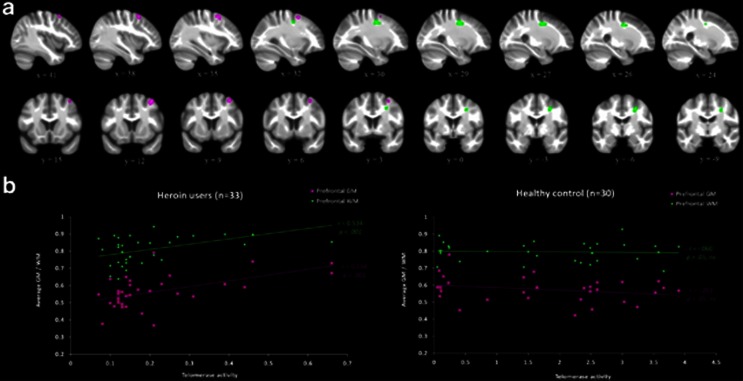
Figure 1.
Volumetric analyses revealing brain regions with significant interaction between group and telomerase activity, and the corresponding scatter plots that depict correlations within each group. (a) The dorsolateral prefrontal cortex (DLPFC) GM cluster (depicted in violet) and WM cluster (depicted in green) that showed significant interactions between group and telomerase activity are shown in sagittal (top panel) and coronal (bottom panel) slices. The left side of the brain is shown on the left. The template brain image is the bias-corrected average image from all participants. Coordinates are in MNI space. (b) Scatter plots showing significant positive correlation between telomerase activity and both clusters in the DLPFC for heroin users (left panel) and nonsignificant (ns) correlation between telomerase activity and both clusters in the DLPFC for the healthy controls (right panel). GM, gray matter; WM, white matter; r=Pearson's correlation coefficient, P=associated P-value.

