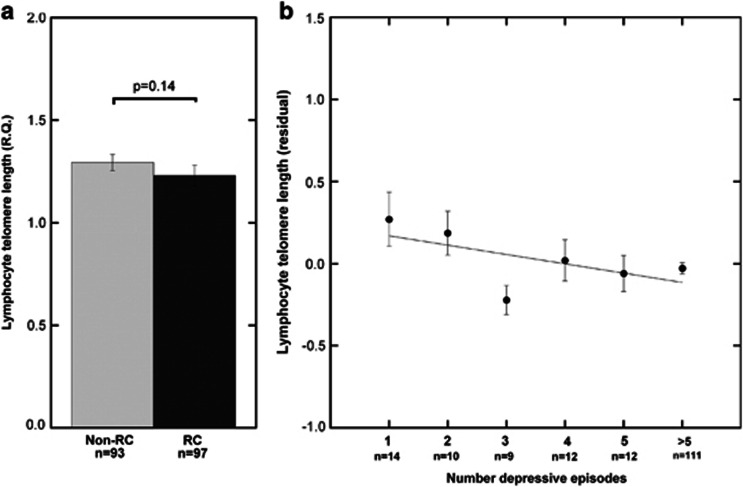
Figure 2.
Lymphocyte telomere length (LTL) point estimate was reduced in those with rapid cycling (RC; P=0.14) (a), and LTL was significantly reduced with increasing number of depressive episodes (P=0.007) (b), with larger effect in males (P=0.006). The scatter plot data shown are from males and females. In (a), the y axis represents LTL relative quantity (RQ) values and patients in RC and non-RC groups are matched for age and sex. In (b), the y axis represents unstandardized residuals of regressing LTL (RQ) on age and sex. Bars and dots indicate the mean and error bars indicate standard error of the mean.

