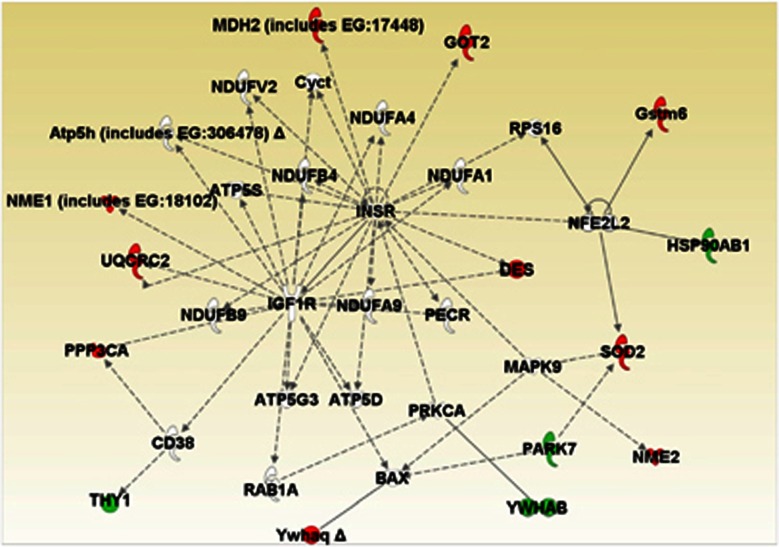
Figure 2.
In silico functional analysis of protein changes in the hippocampus of db/db mice. UniProt accession codes were uploaded into the Ingenuity Pathway Analysis Knowledge Base to determine the most over-represented networks and canonoical pathways associated with the data. Straight lines=direct connections; dotted lines=indirect connections; green colour=increased; red colour=decreased.

