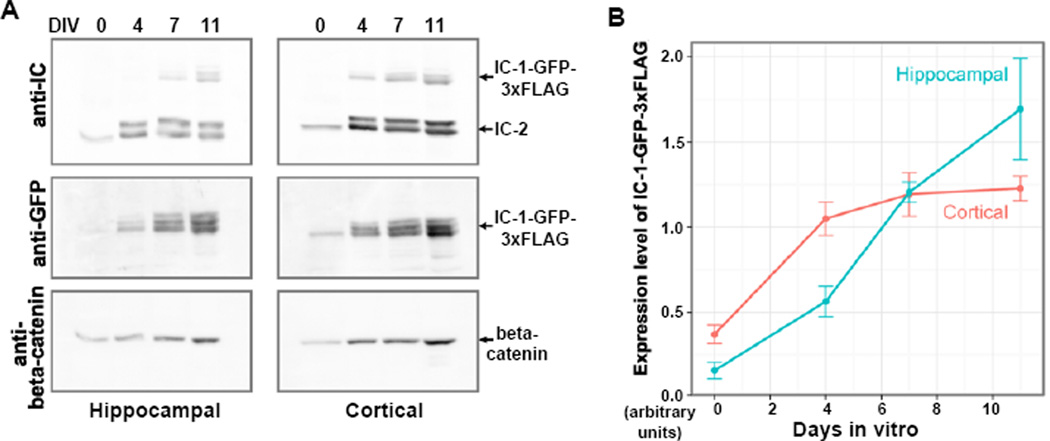
Figure 3.
An analysis of the expression levels of the dynein IC-1-GFP-3xFLAG fusion protein in cultured neurons. (A) Western blots of the cytosolic fraction of hippocampal and cortical E15.5 neuronal cultures, collected on the day of preparation (day 0) or after culture for 4, 7 or 11 days in vitro (DIV) with an equal volume of lysis buffer. Samples of equal volume were loaded onto the protein gel for western blot analyses. The blots were probed sequentially by anti-IC, anti-GFP and anti-beta-catenin antibodies. (B) Change in the expression level of IC-1-GFP-3xFLAG relative to that of beta-catenin correlated with culture time. The signal intensity of IC-1-GFP-3xFLAG revealed by the anti-GFP antibody was normalized to that of beta-catenin for each time point and each neuronal population. The means for each time point and neuronal population were plotted (n = 3 cultures, error bars show SEM).

