
Figure 3.
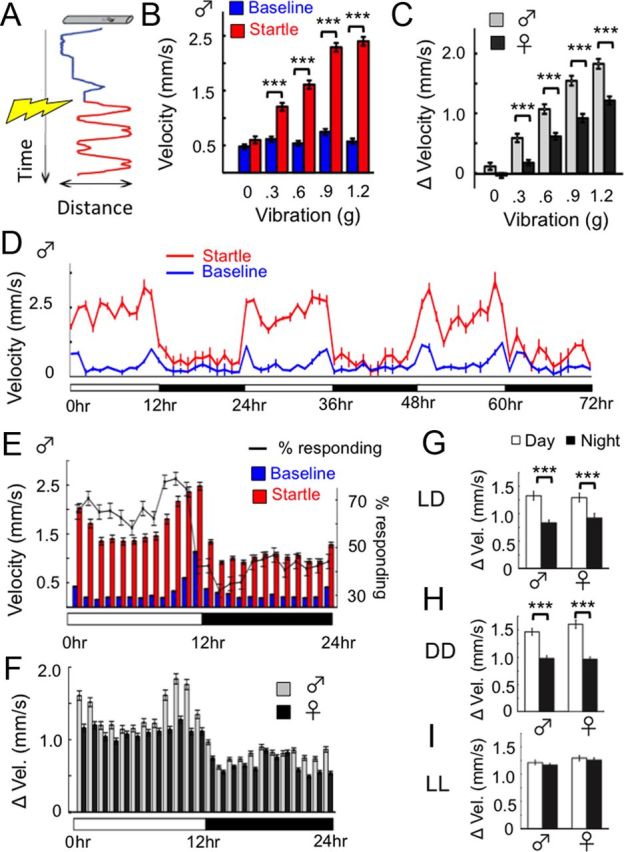
Stimulus-induced locomotion. A, Detection of a startle stimulus (brief vibrations, indicated by yellow flash; see Materials and Methods) increases fly locomotor activity (blue, baseline locomotion; red, startle locomotion). B, Startle responses (red) in wild-type males (± SEM) increase with g (n = 136). ***p < 0.001 by t test compared with mean baseline velocity (blue). C, Stimulus-induced locomotion, the difference between startle and baseline responses, is higher in wild-type males than females. ***p < 0.001 by t test of means. D, Sample experiment showing mean baseline velocity and startle responses to 1.2 g stimulus over 72 h for wild-type males (n = 17). E, Baseline and stimulus-induced velocity (± SEM) in response to hourly stimulation by 1.2 g, for 24 h (n = 136 male wild-type flies). A close correspondence was found between stimulus-induced velocity and the percentage of flies responding (black line, ± SEM; see Materials and Methods). F, Stimulus-induced locomotion (± SEM) over 24 h for wild-type males and females (n = 85 per group). G–I, Average daytime and nighttime stimulus-induced locomotion for wild-type males and females in 12 h LD cycles (n = 85) in DD after LD entrainment (n = 68), and in LL (n = 51). Night and day are subjective for DD and LL based on entrainment schedules. **p < 0.01; ***p < 0.001 by t test comparing means. Error bars show SEM for all graphs.