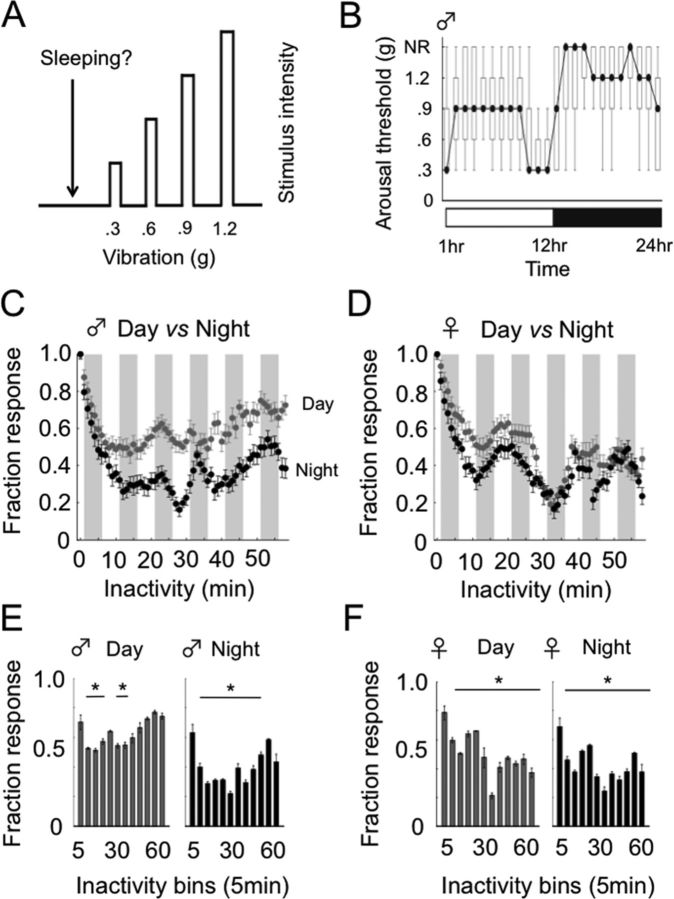
Figure 4.
Different levels of sleep intensity in quiescent flies. A, Increasing g levels were used to determine the minimal level required to induce locomotion in an inactive fly. B, Arousal thresholds (boxplots showing median g, black circles) ± 25–75th percentiles (gray boxes) and min/max values (whiskers) for wild-type males (n = 60) across 24 h. NR indicates nonresponding. C, D, Normalized response probability (fraction response) in wild-type males (C, n = 85) and females (D, n = 85) is plotted against minutes of inactivity before the stimulus (see Materials and Methods). A 1.2 g vibration stimulus was used to probe responsiveness every hour over several consecutive days. Gray circles indicate mean daytime responsiveness; black circles, mean nighttime responsiveness (± SEM). Gray and white shading indicate 5 min inactivity bins. E, F, Data from C and D were binned into 5 min epochs. Mean responsiveness levels (± SEM) were compared for different immobility durations within day (gray) or night (black) sleep bouts. *Bins that differed significantly (p < 0.05) from the first (1–5 min) bin by Tukey post hoc comparison.

