
Figure 5.
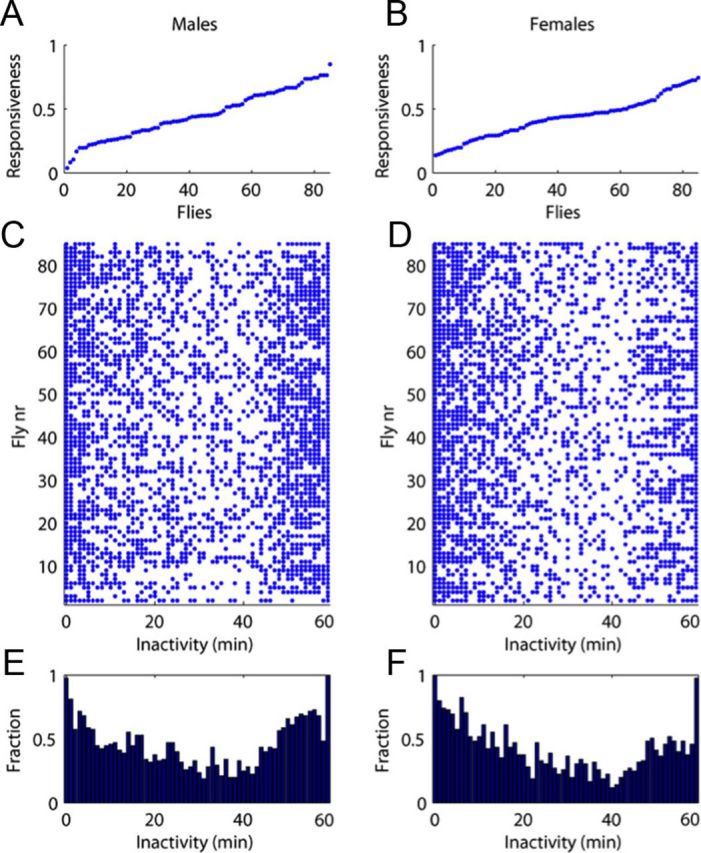
Individual fly sleep data distribution. A, B, Distribution of average responsiveness levels (response probability) for wild-type male (n = 85) and female (n = 85) flies discussed in Figure 4C, D sorted from lowest to highest responders (only flies that were inactive before the startle test are represented). Responsiveness is normally distributed among flies (Lilliefors test, p < 0.05), indicating that the different sleep intensity levels after sleep onset (Fig. 4C,D) are unlikely to reflect subpopulations of flies behaving differently. C, D, Distribution of inactivity data for each fly (same flies as in A,B). The blue dots show, for each fly, whether it contributed to each inactivity bin (0–59 min). (E, F) By summing data from C and D, we determined the proportion (fraction) of flies contributing to each bin. Fewer flies contribute to middle-length inactivity bins (20–40 min), although data within this epoch are evenly distributed among flies.