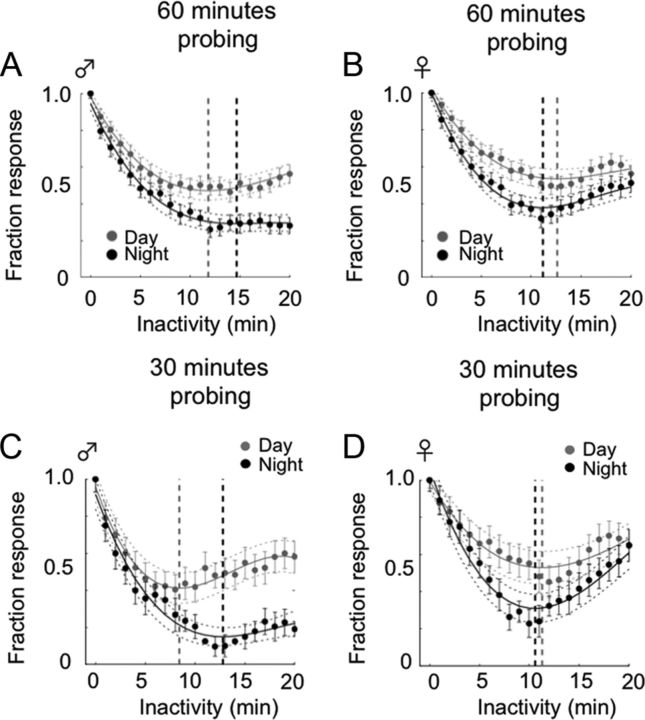
Figure 6.
The first deep-sleep stage. A, B, To quantify deep sleep intensity and timing, third-order polynomials were fitted to smoothed mean responsiveness data from Fig. 4C, D: A, males; B, females, n = 85 in both groups) for the first 20 min of inactivity (see Materials and Methods). The local minimum in the curve indicates the first deep sleep stage (vertical dashed lines at ∼12–15 min). Curves show polynomials fitted to means ± SEM. A, Day, r2 = 0.97; night, r2 = 0.98. B, Day, r2 = 0.96; night, r2 = 0.98. C, D, A 1.2 g vibration stimulus was used to probe responsiveness every 30 min over three consecutive days in separate group of 85 wild-type males and females. Gray circles indicate mean daytime responsiveness; black circles, mean nighttime responsiveness (± SEM).

