
Figure 2.
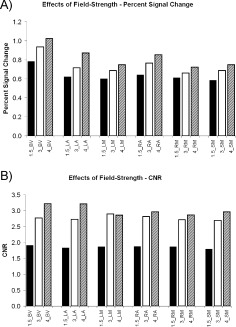
Field strength effects. (A) Mean PSC estimates (based on median ROI extraction) for 1.5T, 3T, and the 4T scanner across six ROIs (BV= bilateral visual cortex, LA = left auditory cortex, LM = left motor cortex, RA = right auditory cortex, RM = right motor cortex and SM = supplementary motor cortex). (B) Mean CNR estimates (based on median ROI extraction) for 1.5T, 3T, and the 4T scanner across six ROIs.