
Figure 7.
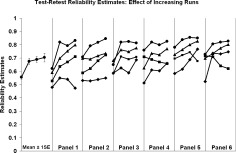
Effect of increasing number of runs. Relationship between number of runs contributing to the average estimate (abscissa) and test–retest ICC for 24 measures [two measurement PSC vs. CNR), six ROIs, and two field strengths). In the most panel, the predicted means and standard errors are plotted from a repeated measures polynomial contrast model. The curves are spread across six panels to enhance visibility of curve. The source of the data in each curve is not identified the figure.