
Figure 2.
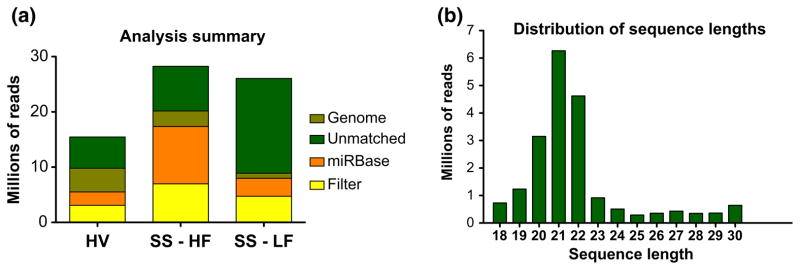
(a) Number of reads that aligned to each subsequent database used in the analysis. (b) Histogram of lengths of sequenced reads before analysis, across all three samples. HV, healthy volunteer; SS-HF, SS patient with high salivary flow; SS-LF, SS patient with low salivary flow