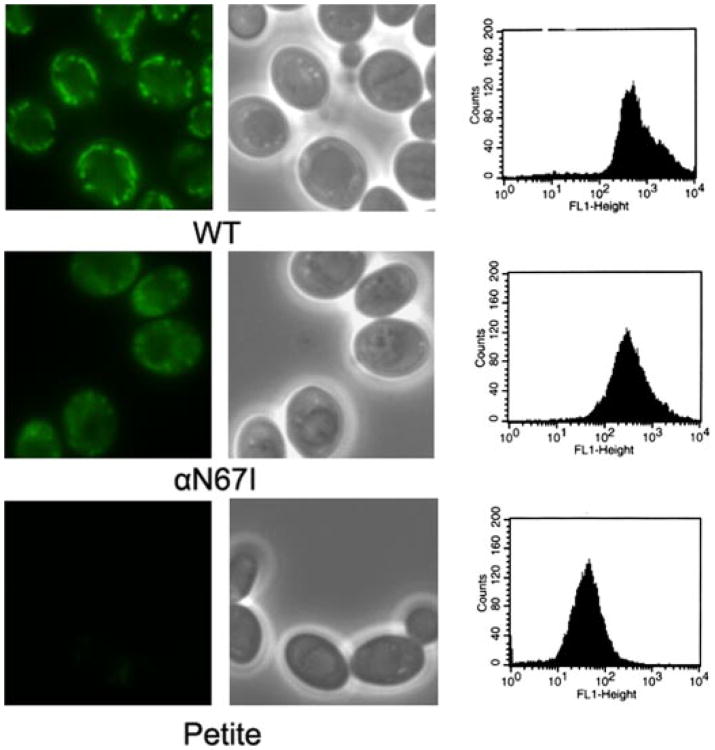
Figure 3. In vivo staining of the mitochondrion as a measure of the membrane potential.
There are three image plates for the wild type, a mutant strain containing the αN67I mutation, and a cytoplasmic petite mutant strain. The first plate is an epifluorescence image of the cells after staining with Rhodamine 123. The second plate is a phase-contrast image of the same view. The final plate represents the data obtained after fluorescent-activated cell counting. Notice the log scale of the abscissa. In the final plate, the area under the curve with the fluorescence height is listed in Table 2, fourth column.

