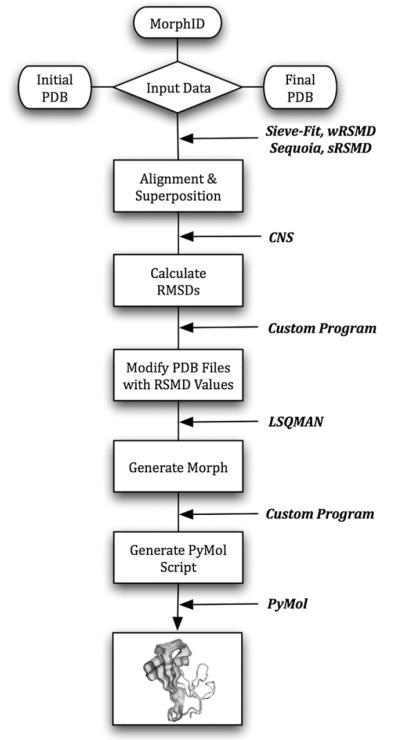
Fig. 1.
Flow chart for producing a ViewMotions Rainbow diagram. The input data is either two PDB files corresponding to the initial and final coordinates of the motion or a MorphID corresponding to a macromolecular motion described by the Database of Macromolecular Movements [1]. Each of the computational steps is indicated by a box and the software used to perform the calculation is indicated.

