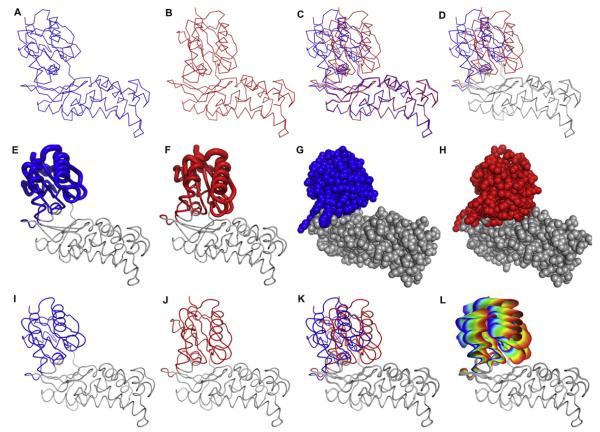
Fig. 2.
Representations of macromolecular motions. (A–D) A comparison of the open and closed forms of hexokinase. (A) The open form of Sulfolobus tokodaii hexokinase in the absence of ligands (PDB ID 2E2N) [13], (B) the closed form of S. tokodaii hexokinase in the presence of glucose and Mg2+•ADP (PDB ID 2E2Q) [13], (C) the open and closed forms overlaid, and (D) the closed and open forms overlaid with the region of the protein undergoing significant conformational change in color. (E–H) Alternate representations of the hexokinase conformational change upon binding glucose. (E) Tube diagram of the open form of hexokinase. (F) Tube diagram of the closed form of hexokinase. In (E) and (F) the diameter of the tube is linearly proportional to the RMSD between the backbone atoms in the open and closed forms. (G) CPK representation of hexokinase in the unliganded form and (H) in the presence of glucose and Mg2+•ADP. The parts of the protein are colored if the RMSD between the open and closed forms is larger than 1.3 Å. (I–L) Steps in the generation of the ViewMotions diagram of hexokinase. (I) The open form of Sulfolobus tokodaii hexokinase in the absence of ligands (PDB ID 2E2N), (J) the closed form of S. tokodaii hexokinase in the presence of glucose and Mg2+•ADP (PDB ID 2E2Q), (K) the open and closed forms of hexokinase aligned, and (L) the ViewMotions Rainbow diagram of hexokinase showing the open form at the blue end of the rainbow and the closed form at the red end of the rainbow. In addition to the open and closed structures, this diagram has thirty intermediate structures calculated between the two extreme forms. Those parts of the structure with a RSMD of greater than 1.3Å are shown in color.

