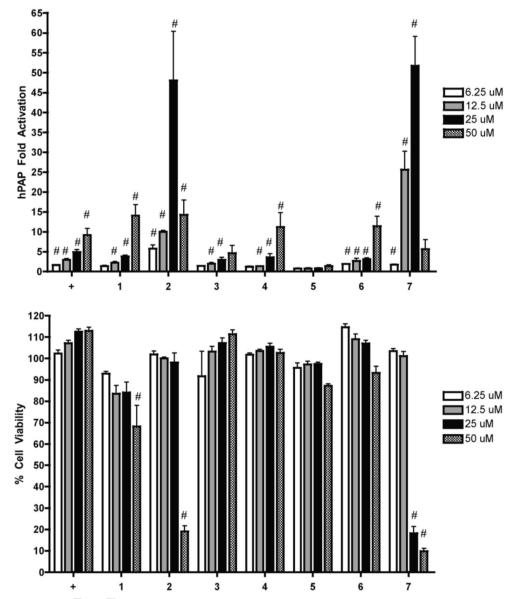
Figure 2.
Nrf2 activation and cytotoxicity of compounds tested.
Primary cortical cultures were prepared and treated with vehicle or compounds at increasing concentrations for 48 hours. A) hPAP activity was measured. All values are standardized to the vehicle treated value and presented as fold change. Mean ± SEM, n = 5, #p < 0.05 vs. vehicle treated cells. B) Cell viability was assessed using the soluble MTS assay. All values are standardized to the vehicle treated value and presented as percent of Mean ± SEM, n = 5, #p < 0.05 vs. vehicle treated cells. + = tBHQ.

