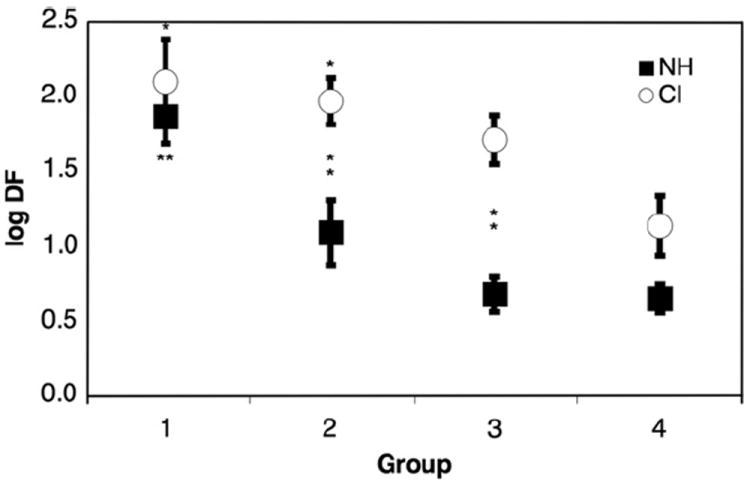
Fig. 5.

Effect of age on frequency discrimination. The figure plots the log DF at 1000 Hz for both CI and NH subjects as a function of age category. Each point is the mean of DF for all subjects in that age category. Error bars represent the standard error of mean. “*” Indicates significance p < 0.05 in comparison to oldest age cohort. “**” Indicates significance p < 0.01 in comparison to oldest age cohort. Vertical “*” indicate significant differences between NH and CI age subgroups.
