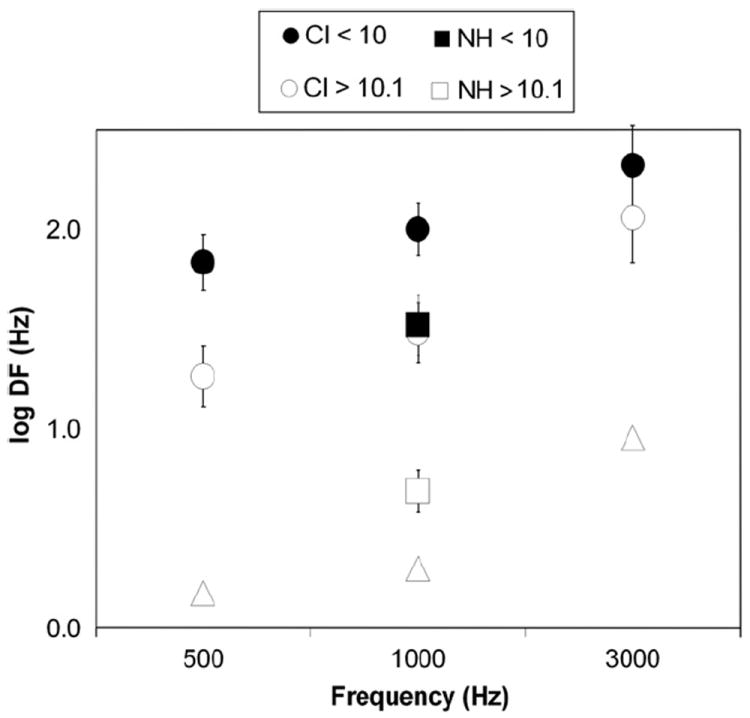
Fig. 6.

Effect of frequency on difference limen plotted logarithmically. This figure plots the log of DF for CI users in this experiment and normal-hearing adults (Wier et al., 1977) at 500, 1000, and 3000 Hz. DF at 1000 Hz is also presented for NH children in this experiment. Frequency DF, despite being an order of magnitude larger in pediatric implantees than in hearing adults, still increases monotonically with respect to base frequency. Error bars represent standard error of the mean.
