
Figure 1.
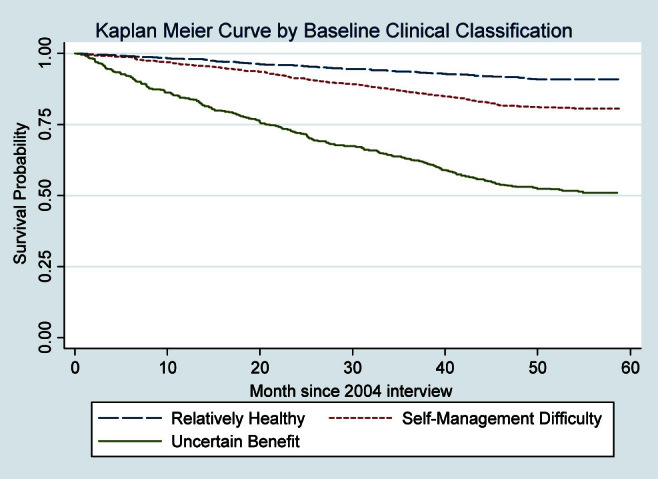
Kaplan Meier survival curves for diabetes clinical groups. Weighted percentages were derived using Health and Retirement Study respondent population weights to adjust for differential probability of selection into the sample and differential nonresponse.