
Figure 2.
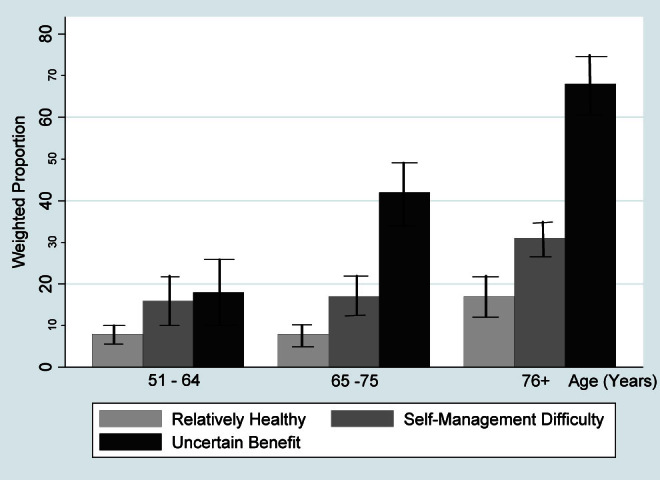
Mortality at 5 y by age and clinical groups. Weighted percentages were derived using Health and Retirement Study respondent population weights to adjust for differential probability of selection into the sample and differential nonresponse.