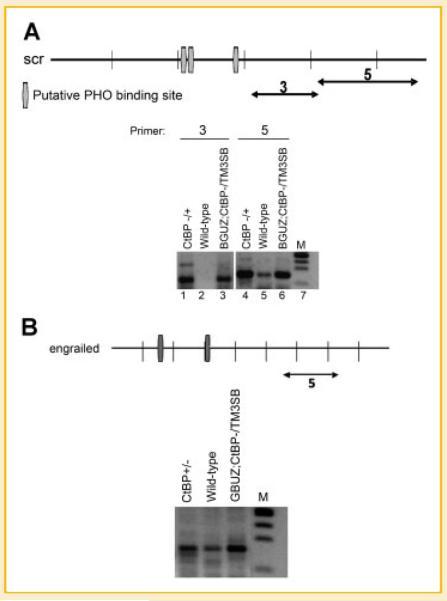
Fig. 2.
CtBP controls intergenic transcripts at the scr (A) and engrailed (B) PRE sequences. Maps of the scr and engrailed PRE regions are shown in the top panels with putative PHO binding sites represented as vertical rectangles. Primer pairs are represented by double-headed arrows. Lower panels show RT-PCR results with RNA isolated from 14 h embryos and the genotype of each sample shown above the lanes. Amplified products for scr primer pairs 3 and 5 are 122 and 150 bp, respectively, and the en amplified product is 152 bp.

