
Figure 4.
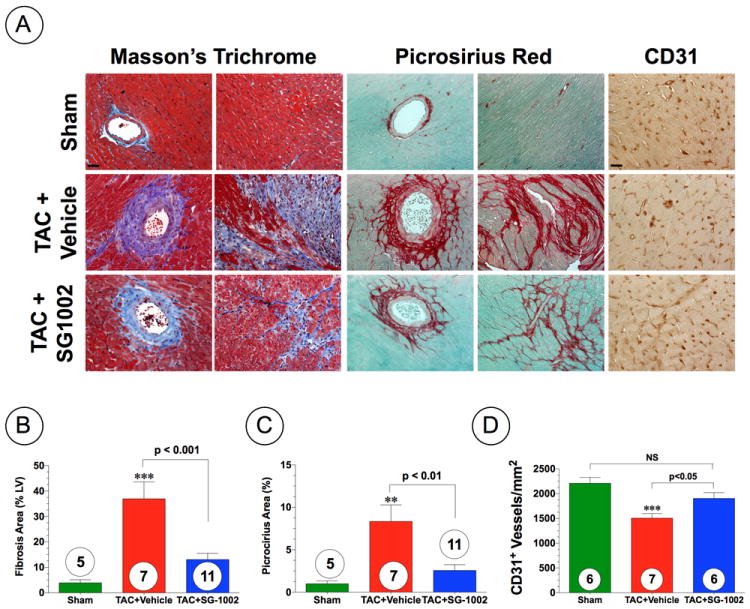
H2S attenuates the intermuscular and perivascular fibrosis following TAC. (A) Representative photomicrographs of Masson’s Trichrome, Picrosirius Red, and CD31 stained heart sections depicting intermuscular and perivascular fibrosis and vascular density in hearts from Sham, TAC+Vehicle, and TAC+SG-1002 treated mice at 6 weeks of TAC. (B) Summary of fibrosis area as % of the LV as calculated from Masson’s Trichrome sections. (C) Summary of fibrosis area as % of the LV calculated from the Picrosirius Red sections. (D) Summary of CD31+ vessels per area (mm2). Results are expressed as mean ± SEM. **p<0.01, and ***p<0.001 vs. Sham.