
Figure 2.
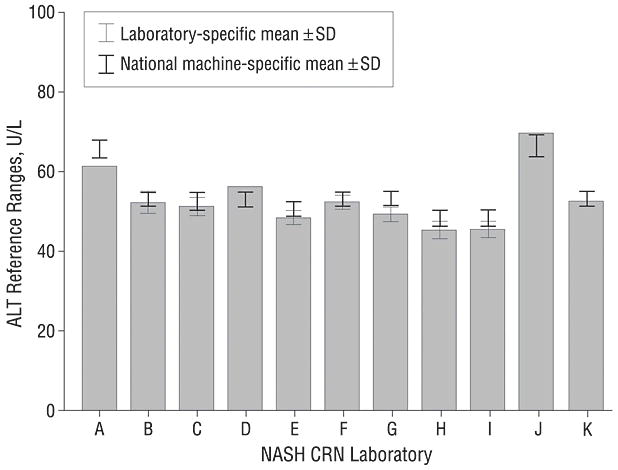
Mean ALT values for CAP sample C15. The gray bars indicate the laboratory specific means of replicate analyses and the thin line error bars indicate ± 1 SD in each direction; four laboratories (A, D, J, K) did not provide standard deviations of their results. The national machine specific mean ± 1 SD in each direction for the analyzer used in each laboratory is indicated by overlying the thick line error bars. The results from most laboratories were within 2 U/L of the national mean for their specific analyzer; laboratory A deviated the most from the national mean yet the difference was still only 4.9 U/L, indicating that laboratory performance was generally excellent.