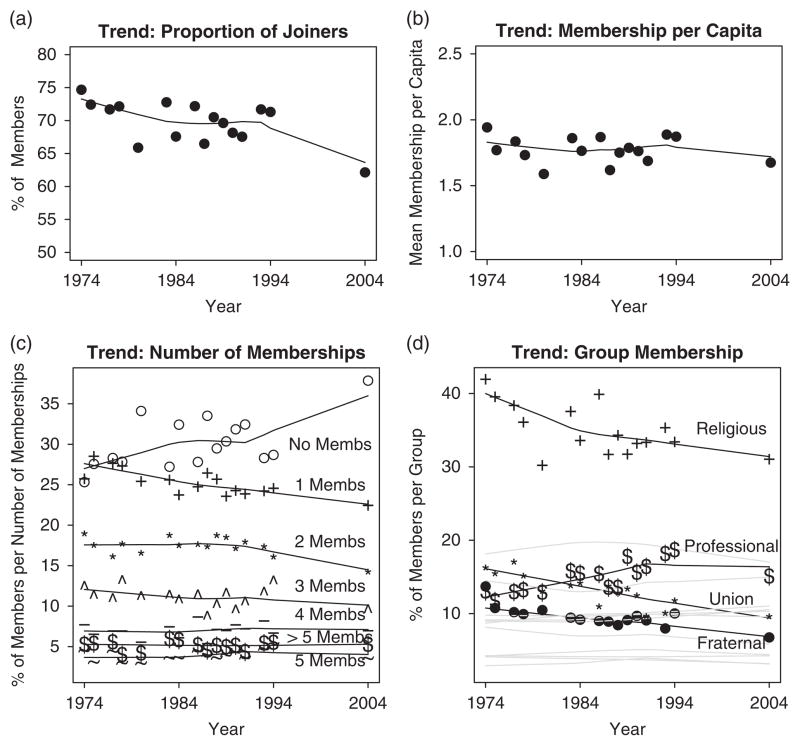
FIGURE 1.
Time Trends in Associational Membership
Notes: x-axis: time (1974–2004). (A) Trend in the proportion of respondents that belong at least to one group. (B) Trend in the average membership per capita. (C) Trend in the number of memberships. (D) Trend in group membership by group. LOWESS curve fitted.

