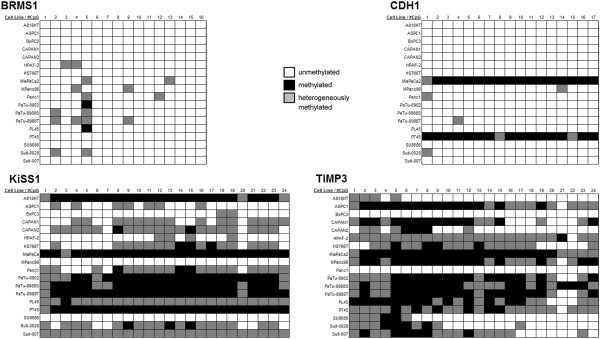
Figure 4.

Methylation volatility. Legend: Each box represents one sequenced CpG in 5′ to 3′ order whose methylation status is indicated by coloration. Some cell lines have uniform methylation patterns throughout the entire investigated region of a gene (e.g. CDH1 in MiaPaCa2: constant methylation pattern), while a more inconsistent pattern is present in other cases (e.g. PL45 in TIMP3: variable methylation pattern).
