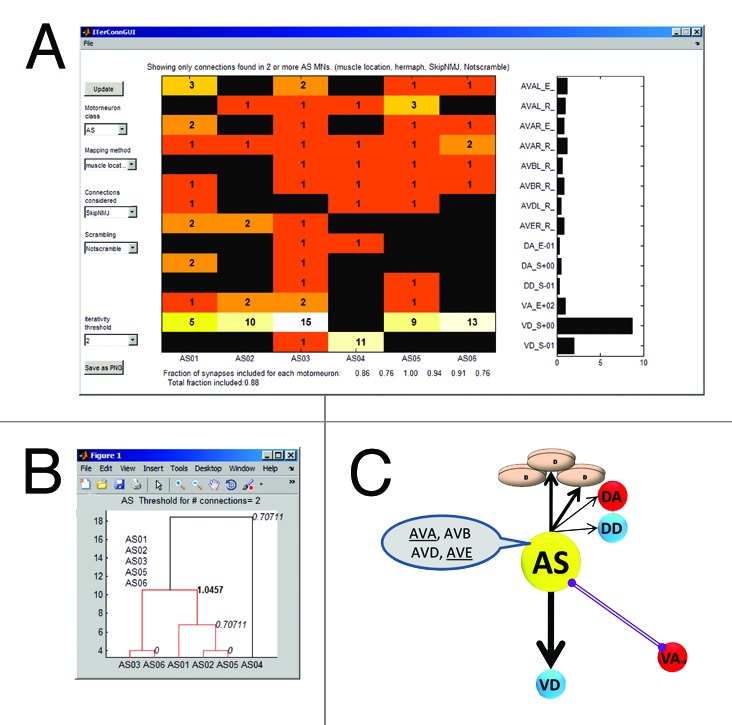
Figure 2. Peri-motor analysis GUI in Matlab and diagram. Example windows of the analysis program we used in Matlab. The GUI (A) allows the user to choose parameters for the analysis (here: motoneuron class AS, mapping method is muscle location with an iteration threshold of 2 and illustrates the iterative connections as a color map and a histogram. Iterativity indices for each motoneuron are indicated below the color map. A dendrogram (B) showing hierarchical clustering of the motoneurons in the class. An alternative presentation (C) of the iterative connections of a stereotypical AS motoneuron is a summary of the histogram in (A). (C) is reprinted from part of Figure 5A in reference 10.
