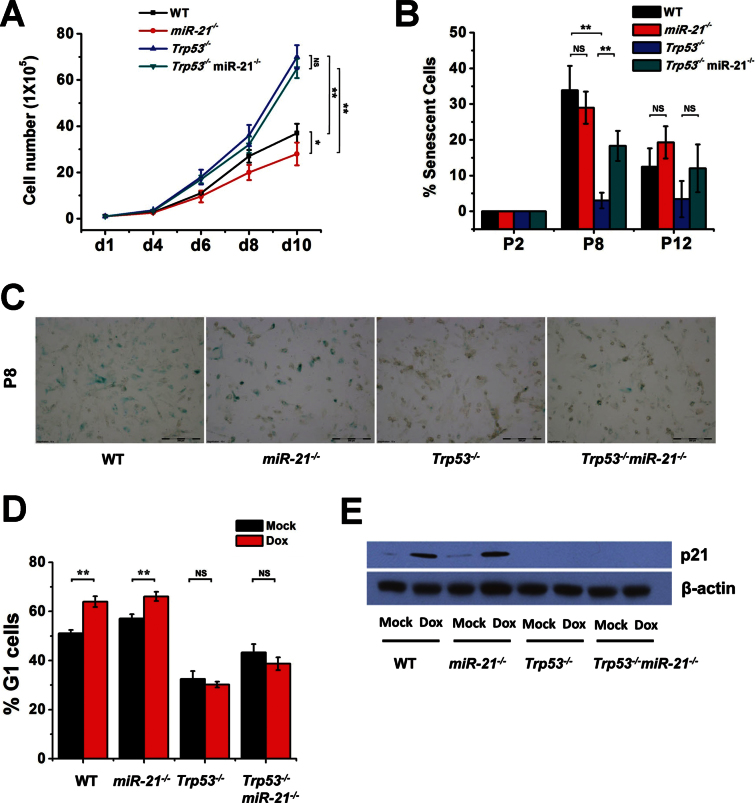
Fig. 2.
Proliferation, senescence and cell cycle in MEFs. (A) Cell proliferation curves of MEFs. WT, miR-21 −/−, Trp53 −/− and Trp53 −/− miR-21 −/− MEFs (P2) were plated on day 1 and counted at the indicated times. (B) Bar graphs of cell senescence of MEFs (WT, miR-21 −/−, Trp53 −/− and Trp53 −/− miR-21 −/−), which were stained with senescence β-galactosidase at the indicated passages and positive-staining cells were counted. (C) Representative images of cell senescence from (B). (D) Cell cycle analysis of MEFs treated with doxorubicin. (E) Western blot analysis of p21 expression in MEFs treated with doxorubicin. All experiments were performed using two or more independent MEF preparations. *P < 0.05; **P < 0.01; NS, not significant.

