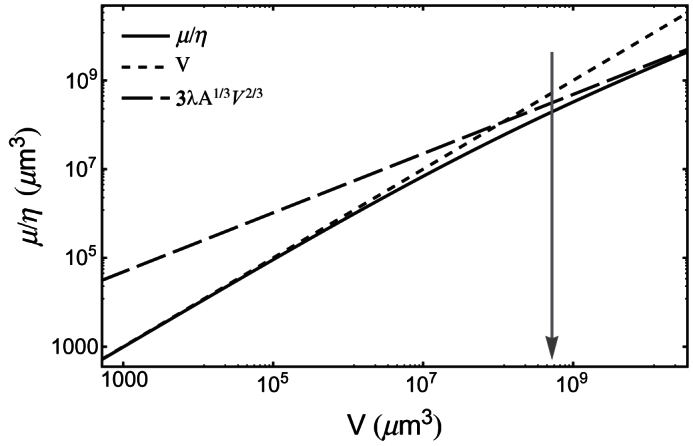
Figure 1. Plot of the normalized nutrient consumption rate  (μm3) vs. tumour volume V (μm3), as given by Eq. (4) (solid line).

Here we assume a spherical shape and λ = 100 μm, which is close to the values found in experimental tumour spheroids1. The dotted line is the normalized rate  from Eq. (5), while the dashed line is
  from Eq. (6). The volume range corresponds to a minimum radius of 5 μm (i.e., approximately a single cell), up to a maximum of 2000 μm. The arrow marks the volume corresponding to a nearly spherical avascular tumour with a diameter of 1 mm.
