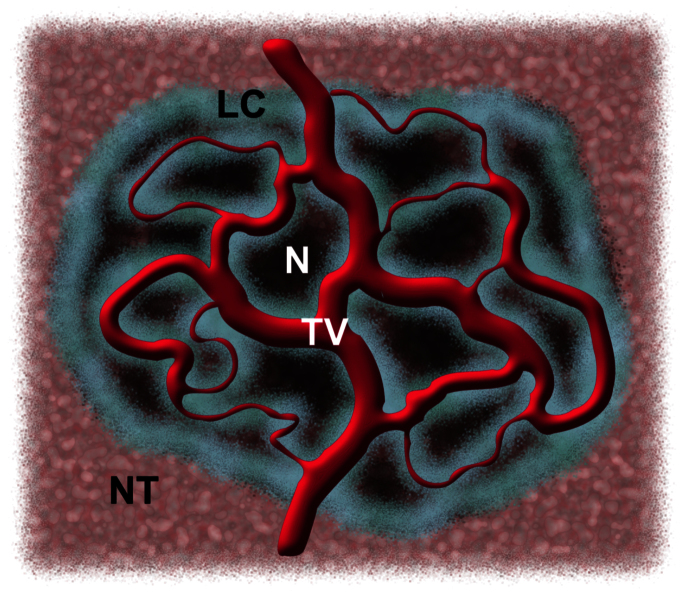
Figure 4. Schematic illustration of a vascularized tumour (not to scale).
Live cells (LC) are distributed along the tumour vasculature (TV) itself and on the tumour boundary where it is close to blood vessels in the normal tissue (NT; blood vessels in normal tissue are not shown). The value of A is determined by the interface between the bulk of the tumour and the non-cancerous environment, and this includes the interface with tumour blood vessels. Areas of tumour quiescence/necrosis (N) are also shown.

