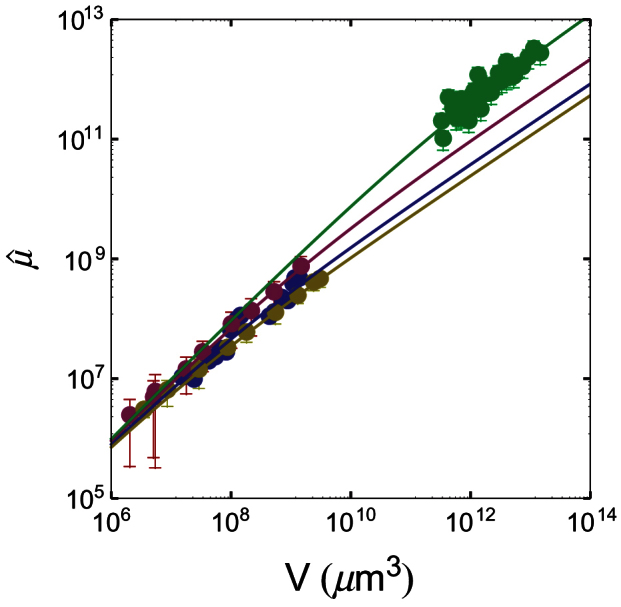
Figure 7. Nonlinear fits of the four data-sets with Eq. (7): symbols, experimental data; lines, nonlinear fit.

The colours of both symbols and lines refer to different experimental data-sets and are as follows: blue, 9L spheroids; red, Rat1-T1 spheroids; yellow, MR1 spheroids; green, human tumours.
