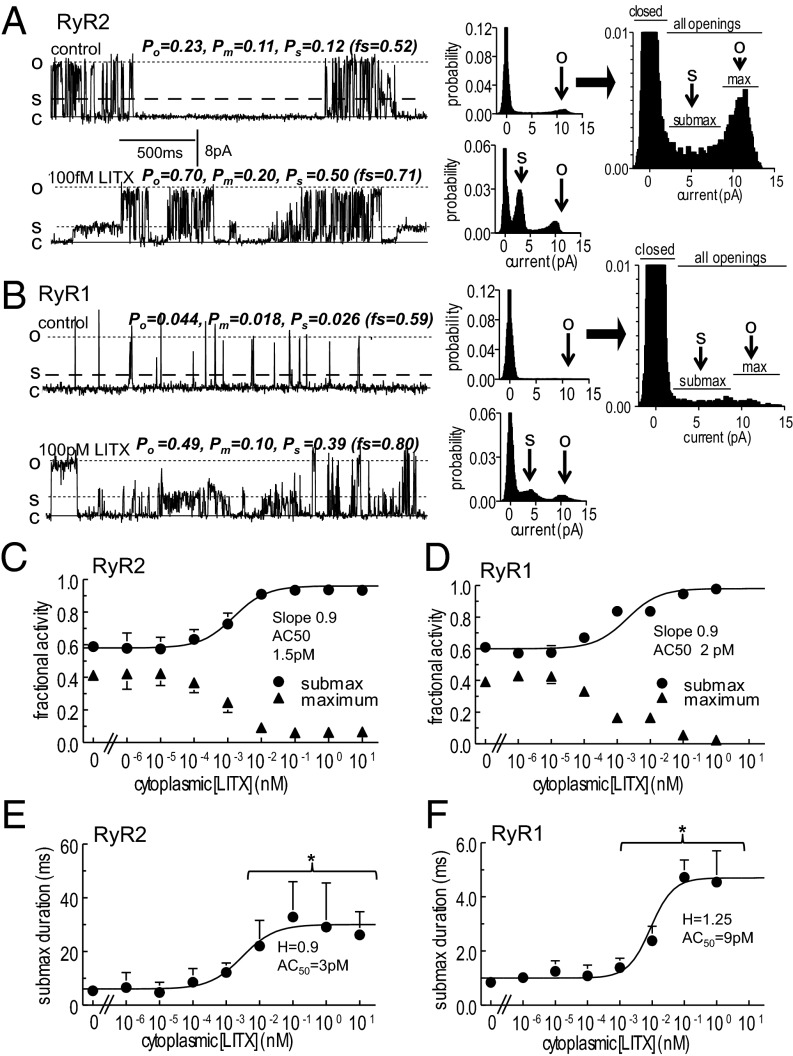
Fig. 2.
Subconductance openings of RyR channels are prolonged by exposure to LITX. (A and B) (Left) Single RyR2 (A) and RyR1 (B) currents at +40 mV, showing prolonged substate openings after addition of LITX at indicated concentrations. Parameter values with each record are for: all openings (Po); maximal openings (Pm); substate openings (Ps); fraction of openings to substate levels (fs = Ps/Po) (plotted in C and D). (Center) All points histograms. The arrow O indicates the full conductance level, and S points to the predominant substate current level. (Right) Histograms for control data, enlarged to illustrate which points fall into the closed bins and which fall into submaximal (submax) or maximal (max) open bins. (C and D) Fraction of openings to substate levels (circles) and to the maximum conductance (triangles). (E and F) Duration of submaximal openings. The curves through the data in C–F were calculated using a Hill equation with constants given in the figure and in the text, and data are shown as mean ± 1 SEM. For visual clarity, only one error bar is shown for some data points. *Significant difference between control data and data in the presence of the toxin.

