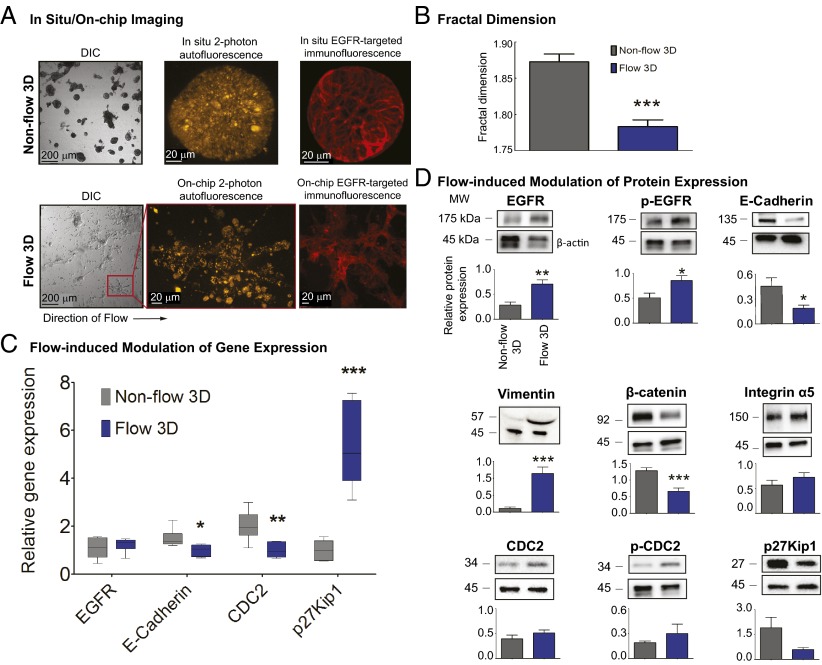
Fig. 4.
Biological characterization of 3D nodules cultured under flow vs. nonflow. (A) Compared with nonflow, 3D ovarian cancer nodules grown under flow exhibited morphological features indicative of increased EMT and a more motile phenotype, as observed by DIC and two-photon autofluorescence microscopy and on-chip immunofluorescence staining of a clinically relevant biomarker, EGFR. (B) Fractal dimension (a ratio describing how an object fills space out to its maximum radius with a value of 1 describing a line and a value of 2 a circle) was used to quantify the morphological features of 3D tumors grown under flow versus nonflow conditions. Fractal dimension was significantly lower under flow (1.78 ± 0.01, n = 8 fields) than in nonflow (1.87 ± 0.01, n = 6 fields) conditions (P < 0.05), supporting the observation that flow induces morphological changes consistent with increased EMT in 3D tumors. *** P < 0.001. (C) A significant down-regulation of E-cadherin and CDC2 gene expression was induced by flow (1.0 ± 0.10 and 1.0 ± 0.14, respectively) compared with nonflow cultures (1.5 ± 0.16 and 2.0 ± 0.25, respectively) (n = 6) (P < 0.05). EGFR gene expression levels were not significantly different between nonflow (1.1 ± 0.17) and flow (1.2 ± 0.12) conditions (n = 6), whereas a significant increase in p27Kip1 gene levels was observed under flow (5.3 ± 0.71) relative to nonflow cultures (1.0 ± 0.17) (n = 6) (P < 0.05). *** P < 0.001. (D) In the presence of flow, a significant increase in EGFR expression and phosphorylation was observed (0.70 ± 0.09 and 0.86 ± 0.10, n = 6 and 4, respectively) as compared with nonflow cultures (0.28 ± 0.06, and 0.51 ± 0.09, n = 6 and 4, respectively) (P < 0.05). E-cadherin protein expression decreased significantly in flow (0.19 ± 0.04) as compared with nonflow 3D cultures (0.45 ± 0.10) (n = 9) (P < 0.05), and vimentin expression increased significantly under flow (1.14 ± 0.19, n = 9) compared with nonflow (0.11 ± 0.04, n = 8) conditions (P < 0.05). A flow-induced down-regulation of β-catenin expression was observed (0.67 ± 0.10 under flow compared with 1.3 ± 0.10 in nonflow cultures) (n = 10) (P < 0.05). There was a trend toward a reversal of the protein expression of p27Kip1 and CDC2 (and activation for CDC2), relative to the gene expression for these markers, as a consequence of flow. ***P < 0.001, **P = 0.001 to <0.01, *P = 0.01 to <0.05.

