Fig. 4.
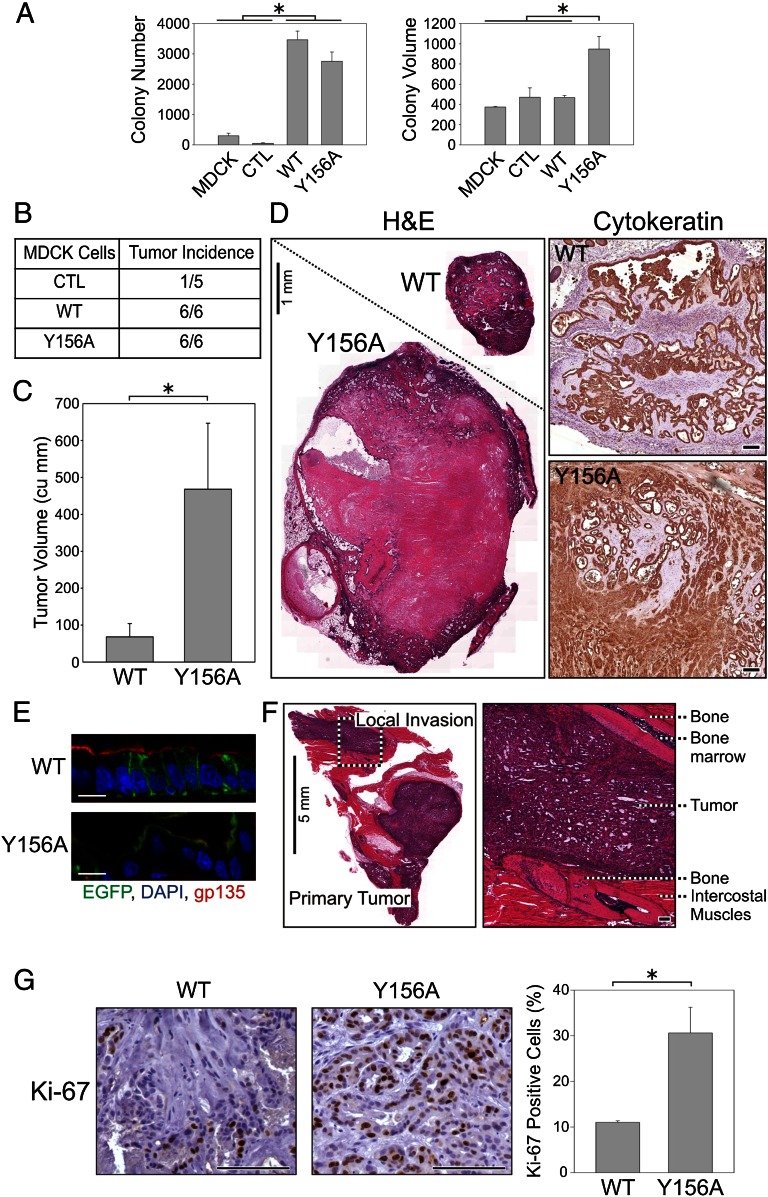
Apically missorted EREG mutants lead to enhanced transformation in vitro and in vivo. (A) A total of 10,000 MDCK cells stably expressing the indicated constructs were embedded in soft agar and allowed to grow for 15 d. (Left) Colony numbers: MDCK, 297 ± 85; GFP = CTL, 54 ± 13; EREG-EGFP = WT, 3,477 ± 287; (Y156A)EREG-EGFP = Y156A, 2,757 ± 303. (Right) Colony volume: WT, 535 ± 35; Y156A, 947 ± 125 (n = 3, mean colony number or volume ± SD). (B and C) Ten million MDCK cells stably expressing indicated constructs were injected s.c. into nude mice. At 4 mo after injection, the number of palpable tumors was scored (B), and the volume of tumors positive for GFP fluorescence was quantified by ultrasound imaging and expressed as mean tumor volume (cu mm) ± SEM; n = 6 (C). WT, 68 ± 36; Y156A, 468 ± 178. (D) (Left) H&E staining of representative formalin-fixed, paraffin-embedded sections from WT and Y156A EREG tumors shown at equal magnification. (Right) An equivalent region from each tumor magnified to an equal extent; cytokeratin staining confirms the epithelial origin of tumors. (Scale bars: Left, 1 mm; Right, 100 µm.) (E) GFP fluorescence (green) shows the basolateral and apical localization of WT and Y156A EREG; cryosections are counterstained for nuclei (DAPI, blue) and apical surface (gp135, red). (Scale bars: 10 µm.) (F) H&E staining of (Y156A)EREG-EGFP-expressing tumors shows local invasion to intercostal muscles. (Left) Gross tumor morphology interspersed between bones and cartilages from the rib cage. (Right) Magnified section of an invasive tumor flanked by two ribs. (Scale bars: Left, 5 mm; Right, 100 µm.) (G) Formalin-fixed, paraffin-embedded sections from MDCK tumors expressing EREG-EGFP (WT) and (Y156A)EREG-EGFP (Y156A) were stained for Ki-67, a marker of cycling cells. For each tumor, at least three nonnecrotic regions were analyzed (totaling more than 1,000 nuclei). (Left) Representative sections. (Right) For quantification, three WT tumors and five Y156A tumors were analyzed; data are plotted as mean ± SEM of the percentage of Ki-67–positive nuclei: WT, 11.0 ± 0.49; Y156A, 30.6 ± 5.64. (Scale bars: 100 µm.) *Statistically significant difference; P = 0.025, two-tailed unpaired t test.

