
Fig. 1.
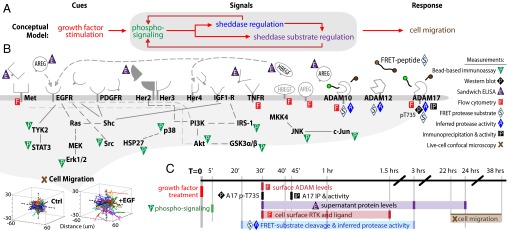
CSR study design. (A) CSR overview: we stimulate endometriotic cells with a panel of growth factor cues; record multiple downstream signals comprising measurements of phospho-signaling, sheddase regulation, and sheddase substrate regulation; and use computational modeling to map these observations onto cell migration responses. (B) Overview of signals and responses included in the CSR dataset. All receptors shown were directly measured and/or stimulated. (C) Experimental timeline of CSR study. Dark colored lines denote measurement time points. At lower left, cell migration is depicted as single-cell tracks, where initial cell positions were centered for visualization.