
Fig. 2.
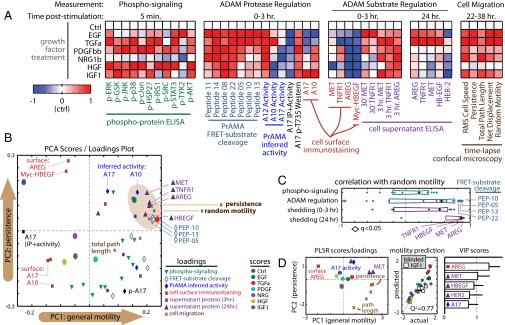
CSR modeling suggests dual ligand/receptor shedding influences cell migration. (A) Heat maps depict CSR dataset, at time points described in Fig. 1C. Data were normalized by control-centering and scaling max absolute value to 1. (B) PCA presents an unsupervised description of covariation within the CSR dataset values in A. The brown ellipse denotes measurements most associated with persistent cell migration. (C) AREG and MET shedding by 24 h poststimulation most closely correlate with random motility, among all measurements in the CSR dataset (q-value denotes multiple-hypothesis–corrected P value). Box-and-whisker bars show the first to third quartiles. (D) The reduced PLSR model describes features of cell migration as a function of select variables from the CSR dataset. The scores/loadings plot (Left) describes covariance among the descriptor variables and migration features. Cross-validation prediction accuracy (Q2 = 77%) was determined with IGF1 measurements blinded from the optimization routine (Center). Model descriptors were ranked by importance according to VIP score (Right). Error bars denote SE.