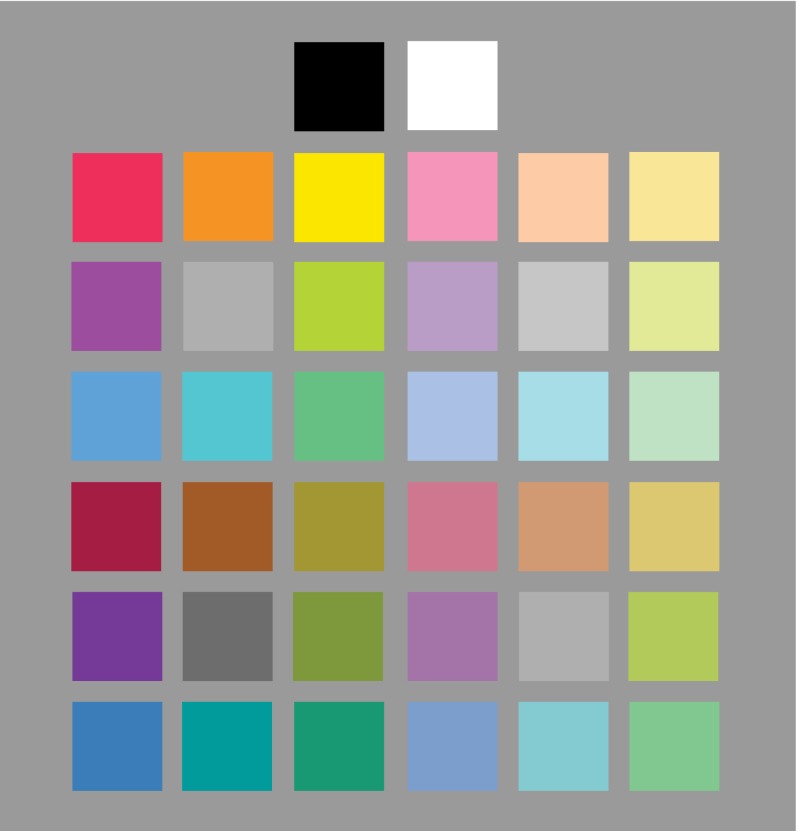
Fig. 1.
The display of 37 colors that was presented during the music–color association task: red, orange, yellow, chartreuse, green, cyan, blue, and purple at four different lightness-saturation levels (saturated, light, muted, and dark), plus three grays, white, and black. (See text and Table S1 for details.) The gray corresponding to the saturated (Top Left) and muted (bottom right) cuts were the same because the saturated and muted cuts had similar mean lightnesses.

