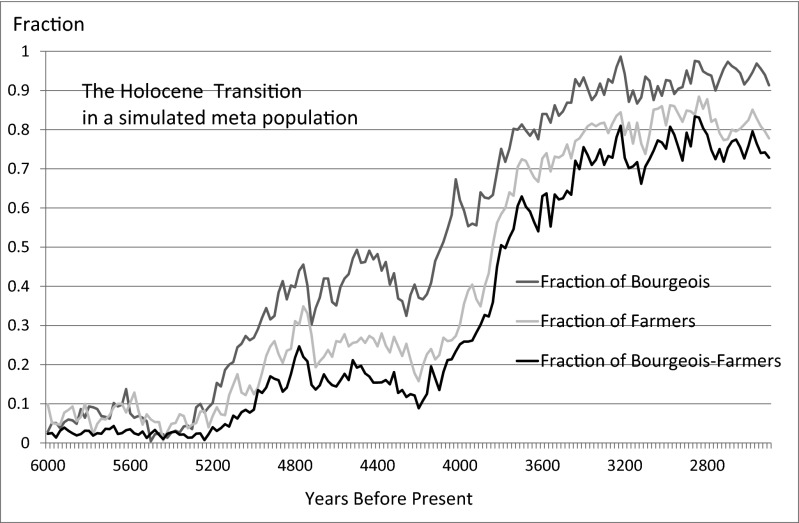
Fig. 3.
Simulated process of transition. Shown are the dynamics occurring in a single implementation of the simulation (a single population representing an ethnolinguistic unit), indicating (vertical axis) the fraction of the population that are, respectively, farmers, adopters of the new property rights, and both (bourgeois farmers) for the given year.

