
Fig. 3.
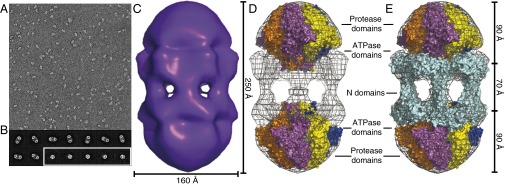
Lon dodecamers and hexamers as visualized by negative-stain EM. (A) Representative field-of-view of electron micrographs of single wild-type Lon particles shows two major populations, differing by roughly twofold in size. (29,000× magnification) (B) Representative class images of dodecamers (Upper and Lower Left) and hexamers (Lower Right, enclosed in white box). Samples were preincubated at 37 °C and following dilution onto grids for imaging contained 0.24 µM Lon (subunit equivalents), 2 µM sul20 peptide, and 50 µM ATPγS. (C) Three-dimensional reconstruction of the Lon dodecamer. In the orientation shown, the dodecamer (displayed in surface representation) is ∼250 Å high and ∼160 Å wide. (D) The Upper and Lower portions of the electron-density map were fit well by hexameric models of the peptidase and ATPase domains from a crystal structure of B. subtilis Lon (3M6A.pdb). (E) Same as D except the equatorial density was fit using a dimeric model of the N domain from E. coli Lon (3LJC.pbd). The equatorial portals between N domains are ∼45 Å in diameter. These figures were generated with PyMOL (v1.2r3pre; Schrödinger) using mesh level 4 and surface level 3.