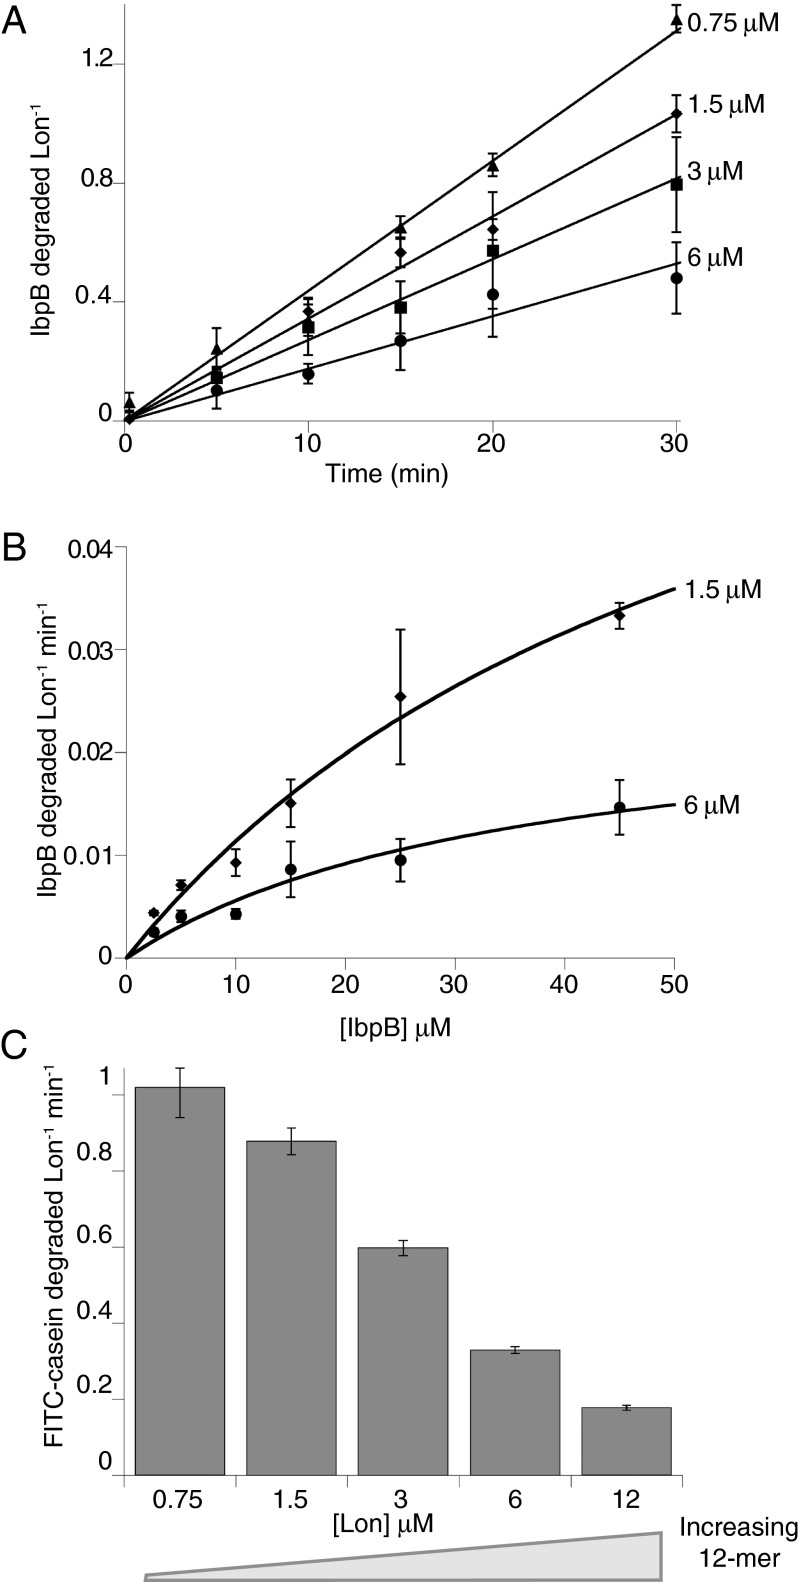
Fig. 5.
High concentrations of Lon degrade IbpB and FITC-casein less efficiently. (A) Normalized initial rates of IbpB degradation (45 µM) decreased as the Lon concentration increased. (B) Michealis–Menten plots of normalized rates of steady-state degradation of IbpB by 1.5 or 6 µM Lon. The lines are fits to the Michealis–Menten equation. (C) Normalized initial rates of degradation of FITC–β-casein (50 µM) also decreased with increasing Lon concentration. In all panels, data are plotted as averages ±1 SEM (n = 3), and reactions were performed at 37 °C and contained 4 mM ATP, 5 mM MgCl2, 5 mM KCl, 2% (vol/vol) DMSO, 360 mM potassium glutamate, 12% (wt/vol) sucrose, and 50 mM Hepes-KOH (pH 8).

