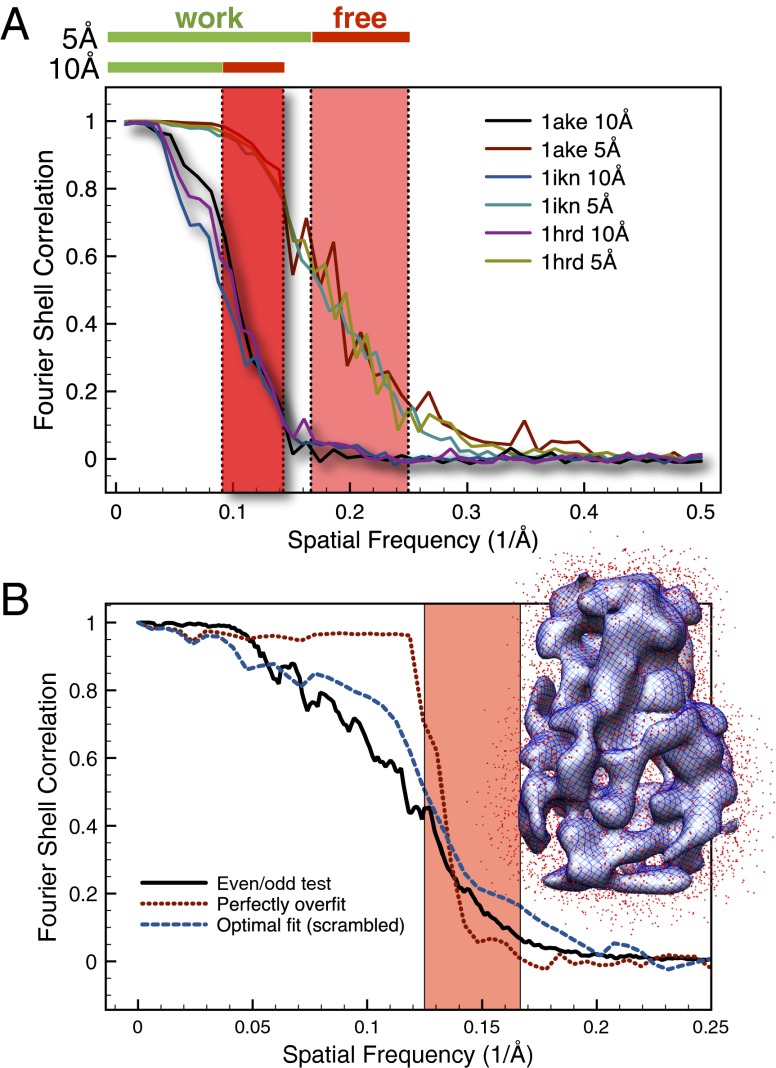
Fig. 1.
(A) FSC curves of the simulated cryo-EM density maps are shown for all three models (1AKE, 1IKN, and 1HRD) at resolutions of 5 and 10 Å. Red bars on top indicate the spatial frequency range that is used as the free band. Green bars on top indicate the spatial frequency range that is used as the work band. (B) FSC curves for the rotavirus DLP are shown for the standard even/odd tests for the low-resolution reconstruction (solid black) and comparison between the low-resolution reconstruction and the density map computed from the optimally fitted (scrambled) crystal structure (dashed blue). The FSC between the low-resolution reconstruction and the perfectly overfitted bead model (dotted red) is significantly larger in the work range and significantly smaller in the free range than the other two curves. The fact that the curve does not drop to zero in the free interval (red area) indicates correlations between structure factors from the work and free ranges. (A and B) The red areas indicate the frequency range that was used for the free interval.

