
Fig. 5.
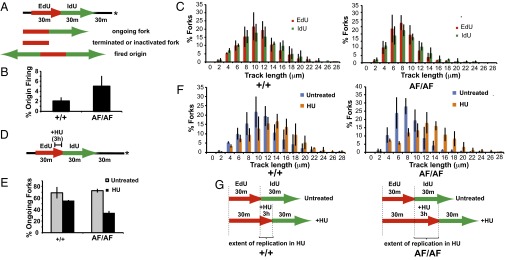
Cdk2AF/AF cells display aberrant replication dynamics. (A) Diagram of replication analysis by sequential labeling with EdU and IdU. Asterisk indicates time of harvest. Representative forks are shown. (B) Bar graph shows that origin firing during the labeling period is increased in Cdk2AF/AF cells (P = 0.042; Materials and Methods) (C) Ongoing forks progress slower in Cdk2AF/AF cells. Bar graphs show the percentages of replication forks with indicated EdU and IdU segment lengths. (D) Labeling scheme for HU arrest/release experiments. HU (2mM) was added at the end of a 30-min EdU labeling interval. After 3 h, HU and EdU were removed, and IdU was added. After 30 min, IdU was removed, and samples were harvested 30 min later. (E) Ongoing forks (EdU-IdU tracks) and terminated or inactivated forks (EdU only) were counted to determine percentage of ongoing forks. Cdk2AF/AF cells have significantly reduced fork restart rate after HU treatment (P = 0.0002). (F) Bar graphs show the percentages of replication forks with indicated EdU segment lengths in either untreated or HU-treated cells. (G) Graphic summary showing that Cdk2AF/AF cells display increased replication in HU. Brackets indicate the increased replication in HU in Cdk2AF/AF cells compared with Cdk2+/+ cells. Data in B, C, E, and F represent averages (with SD) from three experiments.