Fig. 5.
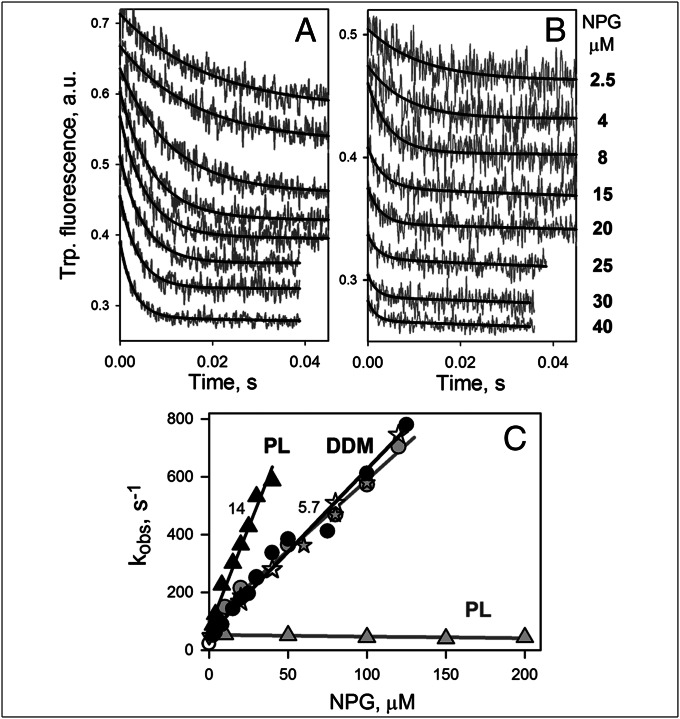
Rates of NPG binding to mutant G46W/G262W measured by Trp→NPG FRET. Stopped-flow traces of Trp fluorescence change (excitation and emission wavelengths 295 and 340 nm, respectively) were recorded after mixing of NPG (at final concentrations indicated) with G46W/G262W (0.5 μM) in DDM (A) or with the same mutant reconstituted into proteoliposomes (B). Sugar-binding rates (kobs) were estimated from single exponential fits (black lines on A and B) and plotted vs. NPG concentrations (C) for NPG binding to the mutant in DDM solution (●), reconstituted into proteoliposomes (PL; ▲) or after dissolving the proteoliposomes in DDM (). Linear fits to the data (kobs = koff + kon[NPG]) are shown as black lines. Numbers near the lines show estimated kon (μM−1⋅s−1) values. Kinetic parameters for NPG binding to mutant G46W/G262W in DDM and in proteoliposomes (data in parentheses) are koff = 55 (75) s−1, kon = 5.7 (14) μM−1⋅s−1, and Kd = 9.7 (5.3) μM. Gray symbols and lines demonstrate kinetics of NPG binding to C154G for comparison. Kinetic parameters measured with C154G in DDM are koff = 100 s−1, kon = 5.0 μM−1⋅s−1, and Kd = 20 μM. Mutant C154G reconstituted into proteoliposomes binds NPG with a kobs = 50 s−1.

