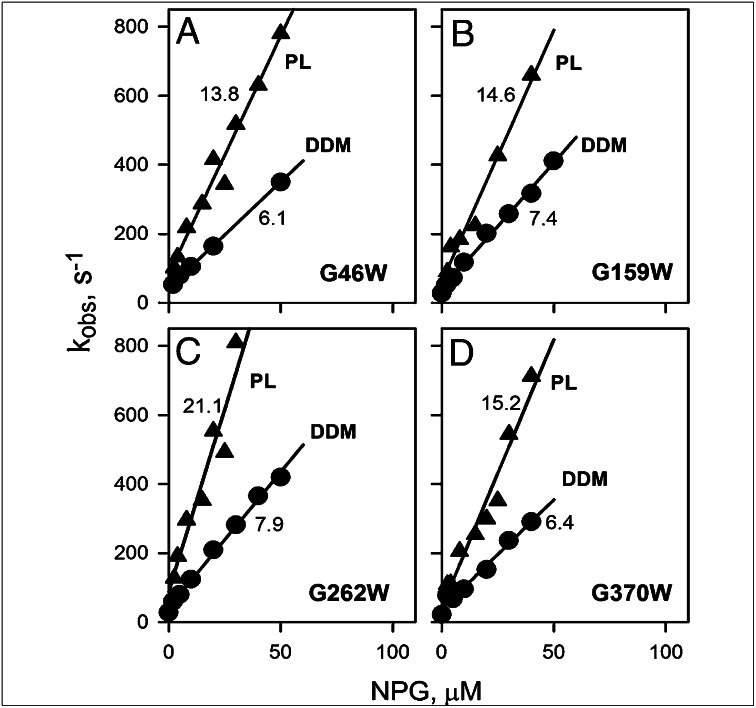
Fig. 6.
Kinetics of sugar binding to single Gly→Trp mutants. Sugar binding rates (kobs) were estimated from single exponential fits of stopped-flow traces similar to those shown in Fig. 5 A and B after mixing of NPG with each purified mutant solubilized in DDM (●) or reconstituted into proteoliposomes (▲). Stopped-flow traces recorded with reconstituted proteoliposomes are presented in Fig. S6. Kinetic parameters for NPG binding to G46W (A), G159W (B), G262W (C), and G370W (D) were obtained from linear fits to the data (solid lines), as shown in Fig. 5C. Numbers near each line represent kon (μM−1⋅s−1) values. Estimated values of koff were 30–40 s−1 in DDM or 50–80 s−1 in proteoliposomes, resulting in high-affinity binding (Kd = 3–7 μM).

