Fig. 1.
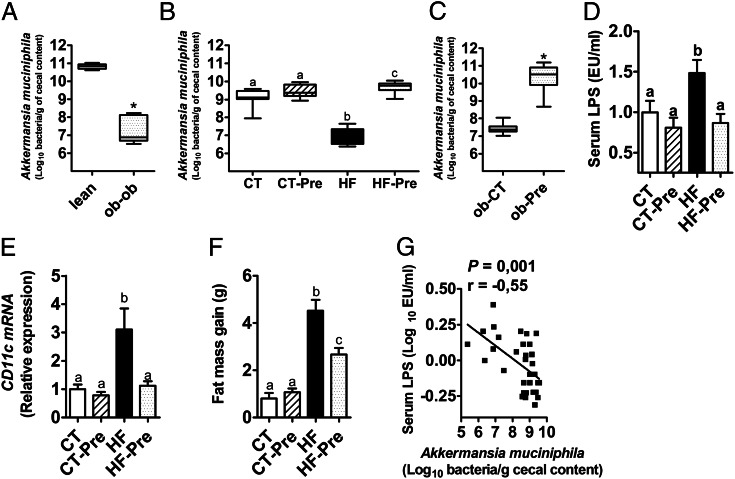
A. muciniphila abundance is decreased in obese and diabetic mice, and prebiotic treatment restored A. muciniphila to basal levels and reversed metabolic endotoxemia and related disorders. (A) A. muciniphila abundance (log10 of bacteria per g of cecal content) measured in the cecal content of leptin-deficient (ob-ob) obese mice and their lean littermates (lean) (n = 5). (B) A. muciniphila abundance (log10 of bacteria per g of cecal content) measured in the cecal content of control diet-fed mice (CT) or CT diet-fed mice treated with prebiotics (CT-Pre) added to their drinking water and HF diet-fed mice (HF) or HF diet-fed mice treated with prebiotics (HF-Pre) added to their drinking water for 8 wk (n = 10). (C) A. muciniphila abundance (log10 of bacteria per g of cecal content) measured in the cecal content of obese mice fed a control diet (ob-CT) or treated with prebiotics (ob-Pre) for 5 wk (n = 10). (D) Portal vein serum LPS levels (n = 7–9). (E) mRNA expression of the adipose tissue macrophage infiltration marker CD11c (n = 10). (F) Total fat mass gain measured by time-domain NMR (n = 10). (G) Pearson’s correlation between log values of portal vein LPS levels and A. muciniphila abundance (log10 of bacteria per g of cecal content); (Inset) Pearson’s correlation coefficient (r) and the corresponding P value. Data are shown as means ± SEM; *P < 0.05 by two-tailed Student t test, data with different superscript letters are significantly different (P < 0.05) according to post hoc ANOVA one-way statistical analysis.

