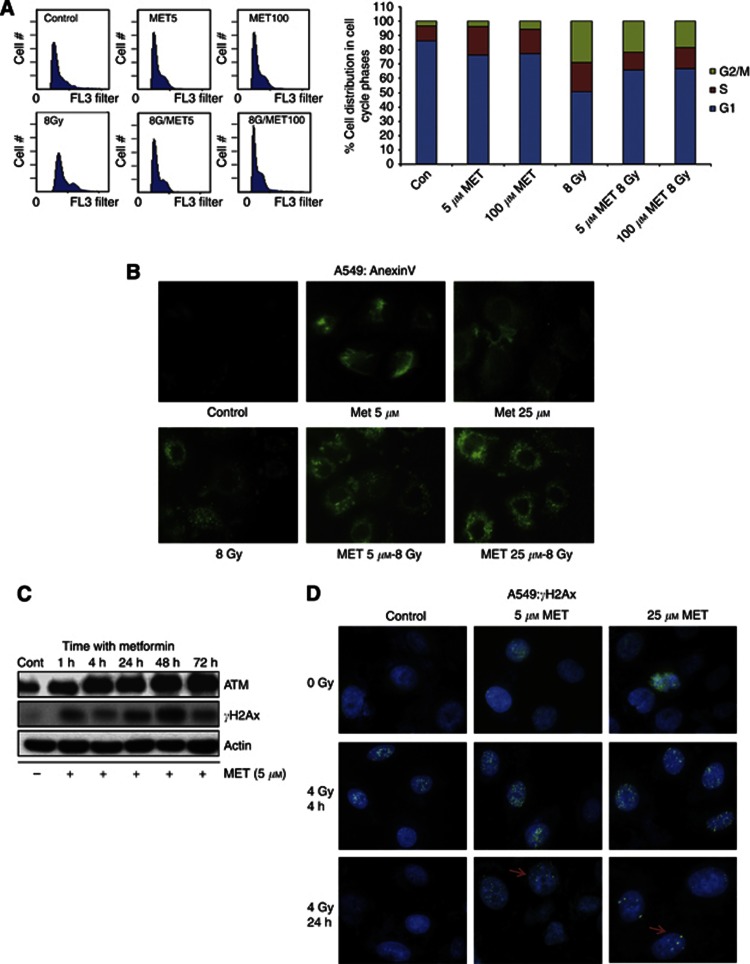
Figure 3.
Modulation of cell cycle, apoptosis and DDR by MET and IR. (A) Cell cycle regulation by MET and IR. A549 cells were treated with 0, 5 or 100 μℳ MET for 24 h before being subjected to either 0 or 8 Gy IR for additional 48 h. Cells were fixed with ethanol and analysed by flow cytometry, as described in Materials and Methods. Representative images are shown. Graph shows results from three independent experiments. (B) Induction of apoptosis by MET and IR. Cells were treated with the indicated concentrations of MET for 48 h and exposure to 0 or 8 Gy IR. Twenty-four hours later, cells were fixed and labelled with an anti-Annexin-V antibody, and visualised under a fluorescent microscope. Representative images from two independent experiments are shown. (C) Response of the DDR pathway to MET treatment. A549 cells were treated with 5 μℳ MET for a period of 1–72 h, after which cells were lysed and lysates were probed with indicated antibodies. Representative immunoblots of four independent experiments are shown. (D) Induction of γH2AX foci by MET and IR. Cells were treated with the indicated concentrations of MET 24 h before 4 Gy IR. Following the indicated times after IR, cells were fixed and stained with DAPI (blue) and an antibody against γH2Ax (green) and visualised at × 40. Representative images of multiple fields are shown for each treatment group.

