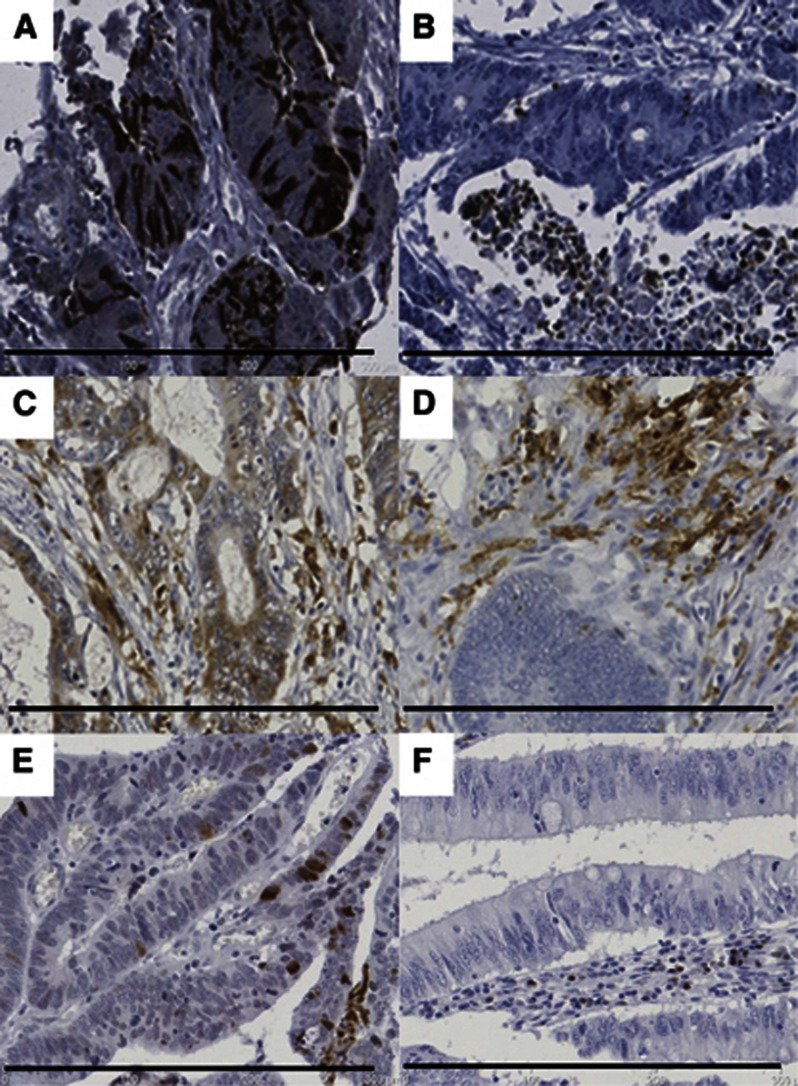
Figure 1.
Representations of staining with CC3, cleaved PARP and MHC-II.Samples depicting (A) CC3 staining of tumour, (B) CC3 staining of stroma (C) MHC-II staining of tumour (D) MHC-II staining of stroma (E) cleaved PARP staining of tumour, (F) cleaved PARP staining of stroma. Resolution of images is 0.46 μm pixel−1. Embedded scale bar represents 300 μm.

