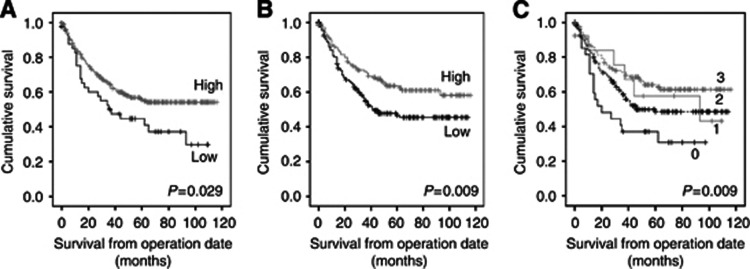
Figure 2.
Kaplan–Meier plot for disease-specific survival relative to CC3.(A) Low CC3 expression in tumour cells (Low) vs high CC3 expression in tumour cells (High; P=0.029). (B) Low CC3 expression in tumour-associated stroma (Low) vs high CC3 high expression in tumour-associated stroma (High; P=0.009). (C) Groups of low CC3 expression in both tumour and tumour-associated stroma (0), low CC3 expression in tumour, high expression in tumour-associated stroma (1), high CC3 expression in tumour, low expression in tumour-associated stroma (2) and high CC3 expression in both tumour and tumour-associated stroma (3); P=0.009. Where tumour low/high=0–60/61–max cells mm−2 and tumour-associated stroma low/high=0–104/105–max cells mm−2.

