


Figure 2.
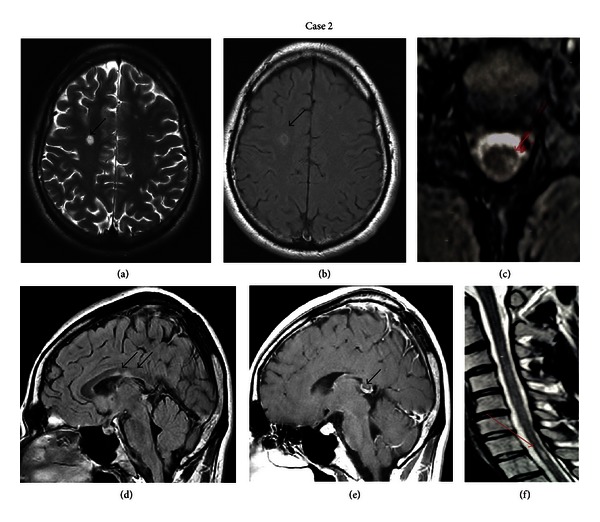
(a) Axial T2- and (b) T1-weighted brain MRI of the second patient showing subcortical hyperintense lesions, one with contrast enhancement (black arrows). (d) and (e) Sagittal T1 weighted with gadolinium brain MRI images showing enhanced corpus callosum lesions (black arrows). (c) Sagittal and (f) axial T2-weighted cervical spine MRI showing one hyperintense lesion (red arrows) on level C7-T1.