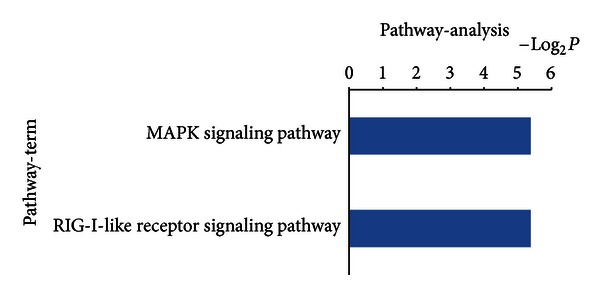
Figure 6.

Bioinformatics interpretation revealed the KEGG genomes regulated by differentially expressed mRNAs. Genes with significant expression differences in the drug and control groups were analyzed by KEGG. P-values ≤ 0.05 were used as a threshold to select significant KEGG analysis.
